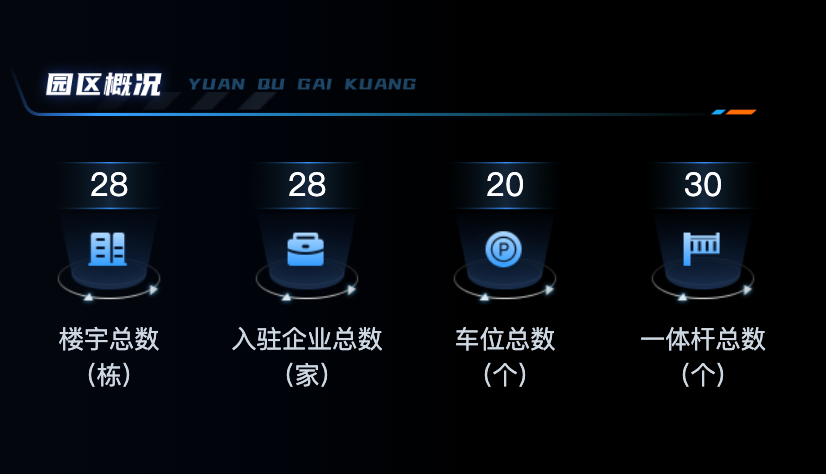
园区概况
cookie共享问题
- 前提 cookie / ls / session 本身会有跨域问题 不同域下的cookie信息是不共享的
- 在主域名一致的情况下,可以让cookie信息实现共享
- 把后台项目启动起来登录一下,把token存入本地cookie,然后把子项目的地址换成
http://localhost:端口 和主项目保持主域一致
准备静态模版
src\views\BigScreenView.vue 复制
vue
<script setup>
</script>

<template>
  <div class="all-charts">
    <!-- 园区概况 -->
    <div class="section-one">
      <img class="img-header"
        src="https://yjy-teach-oss.oss-cn-beijing.aliyuncs.com/smartPark/%E5%A4%A7%E5%B1%8F%E5%88%87%E5%9B%BE/%E5%9B%AD%E5%8C%BA%E6%A6%82%E5%86%B5%402x.png"
        alt="" />
      <div class="icons-container">
        <div class="item">
          <div class="icons-item building-icon">
            <span class="number">
              {{ 0 }}
            </span>
          </div>
          <span class="title">楼宇总数</span>
          <span class="unity">(栋)</span>
        </div>
        <div class="item">
          <div class="icons-item enterprise-icon">
            <span class="number">
              {{ 0 }}
            </span>
          </div>
          <span class="title">入驻企业总数</span>
          <span class="unity">(家)</span>
        </div>
        <div class="item">
          <div class="icons-item car-icon">
            <span class="number">
              {{ 0 }}
            </span>
          </div>
          <span class="title">车位总数</span>
          <span class="unity">(个)</span>
        </div>
        <div class="item">
          <div class="icons-item rod-icon">
            <span class="number">
              {{ 0 }}
            </span>
          </div>
          <span class="title">一体杆总数</span>
          <span class="unity">(个)</span>
        </div>
      </div>
    </div>

    <!-- 园区年度收入分析 -->
    <div class="section-two">
      <img class="img-header"
        src="https://yjy-teach-oss.oss-cn-beijing.aliyuncs.com/smartPark/%E5%A4%A7%E5%B1%8F%E5%88%87%E5%9B%BE/%E5%9B%AD%E5%8C%BA%E5%B9%B4%E5%BA%A6%E6%94%B6%E5%85%A5%E5%88%86%E6%9E%90%402x.png"
        alt="" />
      <div class="bar-chart-titile">
        <span>单位:元</span>
        <div>
          <span class="bar-icon blue-bar-icon"></span>
          <span class="bar-icon red-bar-icon"></span>
          收入情况
        </div>
      </div>
      <div class="bar-chart"></div>
    </div>

    <!-- 园区产业分布 -->
    <div class="section-three">
      <img class="img-header"
        src="https://yjy-teach-oss.oss-cn-beijing.aliyuncs.com/smartPark/%E5%A4%A7%E5%B1%8F%E5%88%87%E5%9B%BE/%E5%9B%AD%E5%8C%BA%E4%BA%A7%E4%B8%9A%E5%88%86%E5%B8%83%402x.png"
        alt="" />
      <div class="pie-chart" ></div>
    </div>
  </div>

    <!-- 3D渲染节点 -->
  <div class="model-container">
    <canvas class="canvas-3d"  />
  </div>
</template>

<style lang="scss">
.all-charts {
  position: absolute;
  top: 0;
  left: 0;
  width: 480px;
  height: 100vh;
  padding: 20px;
  display: flex;
  flex-direction: column;
  justify-content: space-between;
  background: linear-gradient(to left,
      rgba(0, 6, 15, 0) 0%,
      rgba(0, 6, 15, 0) 20%,
      rgba(0, 0, 0, 0.4) 30%,
      rgba(0, 0, 0, 0.6) 40%,
      rgba(1, 4, 11, 1) 70%,
      #04070d 100%);

  .img-header {
    height: 30px;
  }
}

.section-one {
  flex-basis: 25%;

  .icons-container {
    display: flex;
    justify-content: space-between;
    padding: 20px 0;

    .item {
      text-align: center;
      display: flex;
      flex-direction: column;
      flex: 1;

      .icons-item {
        height: 80px;
        position: relative;

        .number {
          position: absolute;
          left: 50%;
          transform: translateX(-50%);
          font-size: 18px;
          font-family: FontquanXinYiGuanHeiTi, FontquanXinYiGuanHeiTi-Regular;
          color: #ffffff;
        }
      }

      .building-icon {
        background: url("@/assets/building-icon.png") no-repeat 50% 0 / contain;
      }

      .enterprise-icon {
        background: url("@/assets/enterprise-icon.png") no-repeat 50% 0 / contain;
      }

      .rod-icon {
        background: url("@/assets/rod-icon.png") no-repeat 50% 0 / contain;
      }

      .car-icon {
        background: url("@/assets/car-icon.png") no-repeat 50% 0 / contain;
      }

      .title,
      .unity {
        font-size: 14px;
        color: #cdd7e1;
      }

      .title {
        margin-top: 8px;
      }
    }
  }
}

.section-two {
  flex-basis: 35%;
  margin-top: 50px;

  .bar-chart {
    width: 100%;
    height: calc(100% - 90px);
  }
}

.section-three {
  flex-basis: 40%;

  .pie-chart {
    position: relative;
    margin: 0 auto;
    padding-bottom: 20px;
    width: 80%;
    height: calc(100% - 40px);
  }
}

.model-container {
  height: 100%;
  background-color: black;
  width: 100%;
  flex-shrink: 0;
}
</style>封装接口并渲染数据
- 封装API接口函数:
src\api\park.js
javascript
import request from '@/utils/request'

/**
 * 获取园区信息
 */
export function getParkInfoAPI () {
  return request({
    url: "/park/statistics/info"
  })
}- 声明变量保存数据、挂载后请求数据
vue
<script setup>
  import { ref, onMounted } from 'vue'
  import { getParkInfoAPI } from '@/api/park'

  const parkInfo = ref({})

  const getParkInfo = async () => {
    const res = await getParkInfoAPI()
    parkInfo.value = res.data
  }

  onMounted(() => {
    getParkInfo()
  })
</script>

<template>
  <div class="all-charts">

    <!-- 园区概况 -->
    <div class="section-one">
      <img class="img-header"
        src="https://yjy-teach-oss.oss-cn-beijing.aliyuncs.com/smartPark/%E5%A4%A7%E5%B1%8F%E5%88%87%E5%9B%BE/%E5%9B%AD%E5%8C%BA%E6%A6%82%E5%86%B5%402x.png"
        alt="" />
      <div class="icons-container">
        <div class="item">
          <div class="icons-item building-icon">
            <span class="number">
              {{ parkInfo.base?.buildingTotal }}
            </span>
          </div>
          <span class="title">楼宇总数</span>
          <span class="unity">(栋)</span>
        </div>
        <div class="item">
          <div class="icons-item enterprise-icon">
            <span class="number">
              {{ parkInfo.base?.enterpriseTotal }}
            </span>
          </div>
          <span class="title">入驻企业总数</span>
          <span class="unity">(家)</span>
        </div>
        <div class="item">
          <div class="icons-item car-icon">
            <span class="number">
              {{ parkInfo.base?.parkingTotal }}
            </span>
          </div>
          <span class="title">车位总数</span>
          <span class="unity">(个)</span>
        </div>
        <div class="item">
          <div class="icons-item rod-icon">
            <span class="number">
              {{ parkInfo.base?.chargePoleTotal }}
            </span>
          </div>
          <span class="title">一体杆总数</span>
          <span class="unity">(个)</span>
        </div>
      </div>

      <!-- 省略其它代码 -->
    </div>
  </div>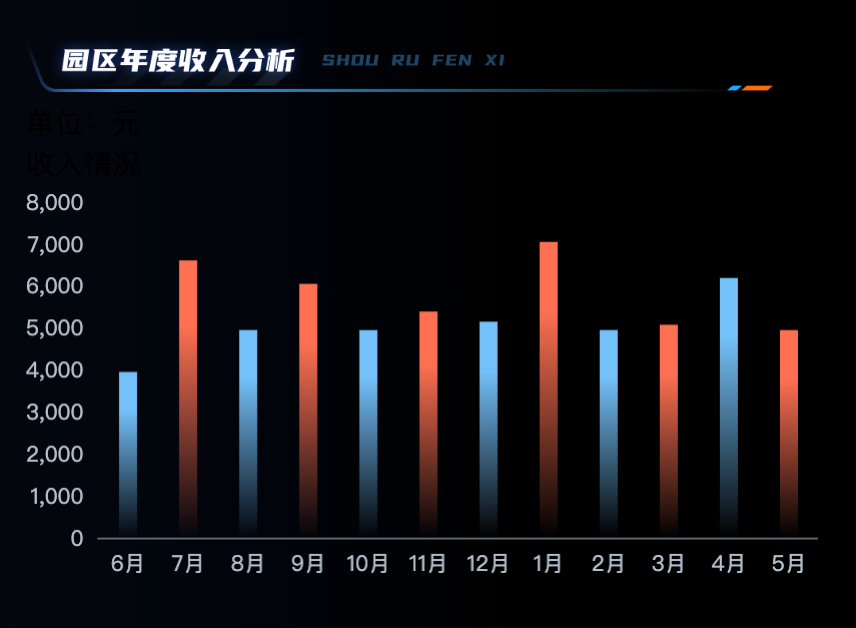
</template>园区年度收入分析
渲染图表
- 安装echarts
bash
npm install echarts- 封装初始化方法并在mounted中执行
vue
<script setup>
import * as echarts from 'echarts'

// 渲染年度收入分析图表
const initBarChart = () => {
  // 1. 解构图表数据
  const { parkIncome } = parkInfo.value
  // 2. 准备options数据
  const barOptions = {
    tooltip: {
      trigger: 'axis',
      axisPointer: {
        type: 'shadow',
      },
    },
    grid: {
      // 让图表占满容器
      top: '10px',
      left: '0px',
      right: '0px',
      bottom: '0px',
      containLabel: true,
    },
    xAxis: [
      {
        type: 'category',
        axisTick: {
          alignWithLabel: true,
          show: false,
        },
        data: parkIncome.xMonth,
      },
    ],
    yAxis: [
      {
        type: 'value',
        splitLine: {
          show: false,
        },
      },
    ],
    series: [
      {
        name: '园区年度收入',
        type: 'bar',
        barWidth: '10px',
        data: parkIncome.yIncome.map((item, index) => {
          const color =
            index % 2 === 0
              ? new echarts.graphic.LinearGradient(0, 0, 0, 1, [
                { offset: 0.23, color: '#74c0f8' },
                { offset: 1, color: 'rgba(116,192,248,0.00)' },
              ])
              : new echarts.graphic.LinearGradient(0, 0, 0, 1, [
                { offset: 0.23, color: '#ff7152' },
                { offset: 1, color: 'rgba(255,113,82,0.00)' },
              ])
          return { value: item, itemStyle: { color } }
        }),
      },
    ],
    textStyle: {
      color: '#B4C0CC',
    },
  }
  // 3. 渲染图表
  const myBarChart = echarts.init(barChart.value)
  myBarChart.setOption(barOptions)
}


onMounted(async () => {
 await getParkInfo()
//  4. 调用初始化图表
 initBarChart()
})
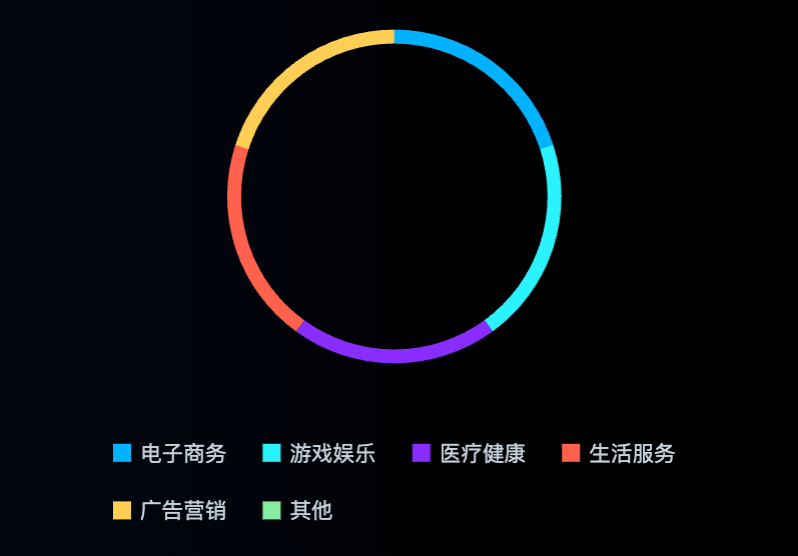
</script>园区产业分布
渲染图表
javascript
// 1. 创建ref
// 2. 绑定ref
const pieChart = ref(null)
// 3. 封装初始化图表的方法
const initPieChart = () => {
  const { parkIndustry } = parkInfo.value
  const pieOption = {
    color: [
      '#00B2FF', '#2CF2FF', '#892CFF', '#FF624D', '#FFCF54', '#86ECA2'],
    legend: {
      itemGap: 20,
      bottom: '0',
      icon: 'rect',
      itemHeight: 10, // 图例icon高度
      itemWidth: 10, // 图例icon宽度
      textStyle: {
        color: '#c6d1db',
      },
    },
    tooltip: {
      trigger: 'item'
    },
    series: [
      {
        name: '园区产业分析',
        type: 'pie',
        radius: ['55%', '60%'], // 设置内圈与外圈的半径使其呈现为环形
        center: ['50%', '40%'], // 圆心位置, 用于调整整个图的位置
        tooltip: {
          trigger: 'item',
          formatter: (params) => {
            return `${params.seriesName}</br><div style='display:flex;justify-content: space-between;'><div>${params.marker}${params.name}</div><div>${params.percent}%</div></div>`
          }
        },
        label: {
          show: false,
          position: 'center',
        },
        data: parkIndustry,
      },
    ],

  }
  const myPieChart = echarts.init(pieChart.value)
  myPieChart.setOption(pieOption)
}

onMounted(async () => {
  await getParkInfo()
  initBarChart()
  //  4. 调用初始化图表
  initPieChart()
})自定义Hook-复用逻辑
基于逻辑拆分优化
基于组件的拆分:
- 增加复用性 - elementUI el-button
- 增加可维护性 - 把一个大的组件.vue 拆分几个小的.vue
组件到底是啥:JS + template + style - 1. 细粒度的纯js的逻辑拆分 2. 组件通信成本的增加
拆分逻辑:把属于同一个业务的相关js代码放到一个小函数中维护,然后把数据和方法return出来给组件使用
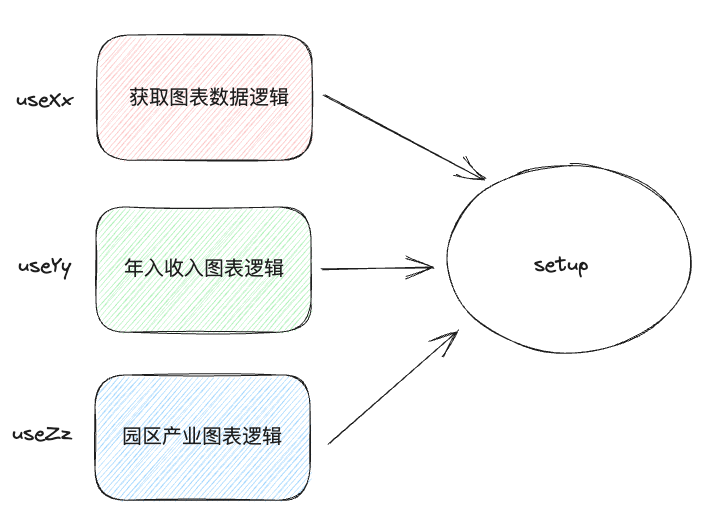
封装可视化数据逻辑
src/hooks/useInitParkInfo.js
javascript
import { ref } from 'vue'
import { getParkInfoAPI } from '@/api/park'
function useInitParkInfo () {
  const parkInfo = ref({})
  const getParkInfo = async () => {
    const res = await getParkInfoAPI()
    parkInfo.value = res.data
  }
  return {
    parkInfo,
    getParkInfo
  }
}

export { useInitParkInfo }封装年入收入图表逻辑
src/hooks/useInitBartChart.js
javascript
import * as echarts from 'echarts'
import { ref } from 'vue'

function useInitBartChart (parkInfo) {
  const barChart = ref(null)
  // 渲染年度收入2d分析图表
  const initBarChart = () => {
    const { parkIncome } = parkInfo.value
    const barOptions = {
      tooltip: {
        trigger: 'axis',
        axisPointer: {
          type: 'shadow',
        },
      },
      grid: {
        // 让图表占满容器
        top: '10px',
        left: '0px',
        right: '0px',
        bottom: '0px',
        containLabel: true,
      },
      xAxis: [
        {
          type: 'category',
          axisTick: {
            alignWithLabel: true,
            show: false,
          },
          data: parkIncome.xMonth,
        },
      ],
      yAxis: [
        {
          type: 'value',
          splitLine: {
            show: false,
          },
        },
      ],
      series: [
        {
          name: '园区年度收入',
          type: 'bar',
          barWidth: '10px',
          data: parkIncome.yIncome.map((item, index) => {
            const color =
              index % 2 === 0
                ? new echarts.graphic.LinearGradient(0, 0, 0, 1, [
                  { offset: 0.23, color: '#74c0f8' },
                  { offset: 1, color: 'rgba(116,192,248,0.00)' },
                ])
                : new echarts.graphic.LinearGradient(0, 0, 0, 1, [
                  { offset: 0.23, color: '#ff7152' },
                  { offset: 1, color: 'rgba(255,113,82,0.00)' },
                ])
            return { value: item, itemStyle: { color } }
          }),
        },
      ],
      textStyle: {
        color: '#B4C0CC',
      },
    }
    const myBarChart = echarts.init(barChart.value)
    myBarChart.setOption(barOptions)

  }
  return {
    barChart,
    initBarChart
  }
}

export { useInitBartChart }封装园区产业逻辑
src/hooks/useInitPieChart.js
javascript
import { ref } from 'vue'
import * as echarts from 'echarts'

function useInitPieChart (parkInfo) {
  // 渲染园区产业2d分布图表
  const pieChart = ref(null)
  const initPieChart = () => {
    const { parkIndustry } = parkInfo.value
    const pieOption = {
      color: [
        '#00B2FF', '#2CF2FF', '#892CFF', '#FF624D', '#FFCF54', '#86ECA2'],
      legend: {
        itemGap: 20,
        bottom: '0',
        icon: 'rect',
        itemHeight: 10, // 图例icon高度
        itemWidth: 10, // 图例icon宽度
        textStyle: {
          color: '#c6d1db',
        },
      },
      tooltip: {
        trigger: 'item'
      },
      series: [
        {
          name: '园区产业分析',
          type: 'pie',
          radius: ['55%', '60%'], // 设置内圈与外圈的半径使其呈现为环形
          center: ['50%', '40%'], // 圆心位置, 用于调整整个图的位置
          tooltip: {
            trigger: 'item',
            formatter: (params) => {
              return `${params.seriesName}</br><div style='display:flex;justify-content: space-between;'><div>${params.marker}${params.name}</div><div>${params.percent}%</div></div>`

            }
          },
          label: {
            show: false,
            position: 'center',
          },
          data: parkIndustry,
        },
      ],

    }
    const myPieChart = echarts.init(pieChart.value)
    myPieChart.setOption(pieOption)

  }
  return {
    pieChart,
    initPieChart
  }
}

export { useInitPieChart }统一入口导出
src/hooks/index.js
js
export * from './useInitBartChart'
export * from './useInitParkInfo'
export * from './useInitPieChart'组合业务逻辑
vue
<script setup>
import { onMounted } from 'vue'

import { useInitParkInfo, useInitBartChart, useInitPieChart } from '@/hooks'
// 获取园区数据
const { parkInfo, getParkInfo } = useInitParkInfo()

// 渲染年度收入分析2d图表
const { initBarChart, barChart } = useInitBartChart(parkInfo)

// 渲染园区产业分布2d图标
const { initPieChart, pieChart } = useInitPieChart(parkInfo)


// 调度图表渲染
onMounted(async () => {
  // 保证数据先回来
  await getParkInfo()
  initBarChart()
  initPieChart()
})

</script>3D可视化的搭建流程说明
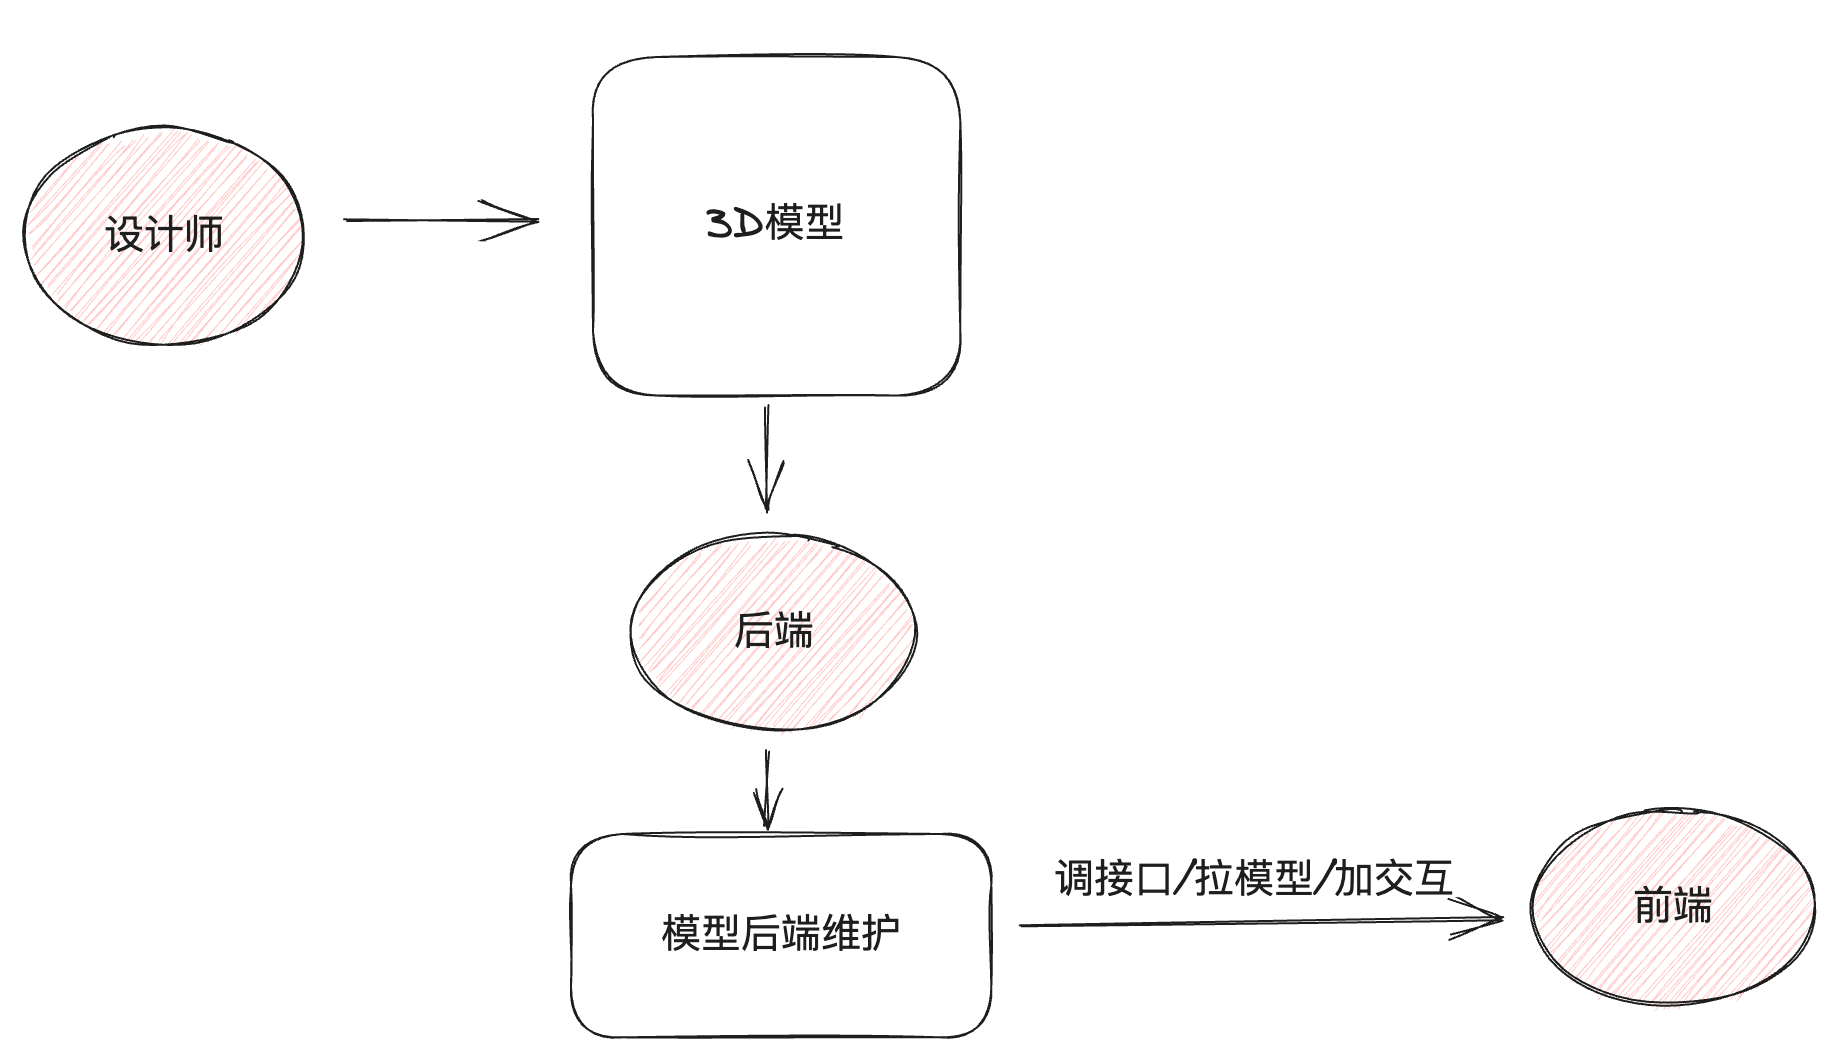
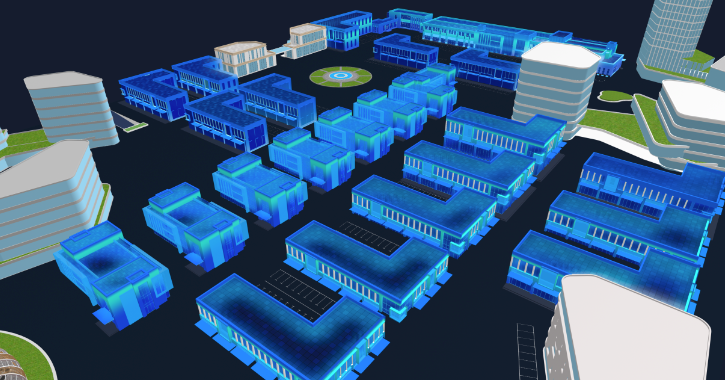
前端加载3D模型
需求:在浏览器中渲染出来3D模型
下载模型解析包
说明:模型解析包和制作3D的软件是配套的
bash
npm i @splinetool/runtime拉取模型并渲染
说明:spline实例既可以拉取模型同时拉取完毕之后会在canvas节点上渲染画布
src\views\BigScreenView.vue
vue
<script setup>
import { onMounted, ref } from 'vue'

// 其它三个图表的代码省略

// 导入模型解析构造函数
import { Application } from '@splinetool/runtime'

// 初始化3d模型
const ref3d = ref(null)

const init3dModel = () => {
  // 实例化解析器实例
  let spline = new Application(ref3d.value)
  // 拉取模型
  spline.load('https://fe-hmzs.itheima.net/scene.splinecode').then(() => {
    console.log('3D模型加载并渲染完毕')
  })
}
// dom节点渲染完毕再加载
onMounted(() => {
  await getParkInfo()
  initBarChart()
  initPieChart()
  init3dModel()
})

</script>

<template>
	<div class="all-charts">
   ...代码省略...
  </div>

	<!-- 3d模型区域 -->
  <div class="model-container">
    <!-- 准备3D渲染节点 -->
    <canvas class="canvas-3d" ref="ref3d" />
  </div>
</template>添加进入条

纯展示类组件,只需要设计一个参数,显示隐藏 loading prop true 显示 false 隐藏
- 封装组件
src\components\LoadingComponent.vue
vue
<script setup>
defineProps({
  loading: Boolean
})
</script>

<template>
  <div v-if="loading" class="loading">
    <p class="text">园区资源加载中…</p>
    <div class="loading-process">
      <div class="process-wrapper"></div>
    </div>
  </div>
</template>

<style lang="scss">
.loading {
  position: absolute;
  left: 66%;
  top: 40%;
  transform: translateX(-50%);
  text-align: center;

  .text {
    font-size: 14px;
    color: #909399;
    margin-bottom: 16px;
  }

  .loading-process {
    width: 280px;
    height: 4px;
    background: rgba(255, 255, 255, 0.16);
    border-radius: 20px;
    overflow: hidden;
  }

  .process-wrapper {
    height: 100%;
    width: 5%;
    background: linear-gradient(90deg, #48ffff 0%, #3656ff 100%);
    animation-duration: 1000s;
    animation-name: loading;
  }

  @keyframes loading {
    0% {
      transform: scaleX(1);
    }

    1% {
      transform: scaleX(38);
    }

    100% {
      transform: scaleX(40);
    }
  }
}
</style>2- 导入loading根据状态控制显示
vue
<script setup>
import { onMounted, ref } from 'vue'
// 导入模型解析构造函数
import { Application } from '@splinetool/runtime'
// 导入loading组件
import LoadingComponent from '@/components/LoadingComponent.vue'

// 1. 创建
const loading = ref(false)

// 调用接口拉取3d模型 渲染视图中
const ref3d = ref(null)
const init3dModel = () => {
  // 2. 开启loading
  loading.value = true
  const spline = new Application(ref3d.value)
  spline.load(`https://fe-hmzs.itheima.net/scene.splinecode`).then(() => {
    // 3. 拉取资源之后.then方法中可以做后续的逻辑操作
    showLoading.value = false
  })
}

onMounted(async () => {
  await getParkInfo()
  initBarChart()
  initPieChart()
  init3dModel()
})

</script>


<template>
  <!-- 3d模型渲染节点 -->
  <div class="model-container">
    <!-- 进度条 -->
    <LoadingComponent :loading="loading" />
    <!-- 准备3D渲染节点 -->
    <canvas class="canvas-3d" ref="ref3d" />
  </div>
</template>大屏适配方案
需求: 适配几个固定的设备 要求在一个主屏上完美适配最贴合UI设计稿,其它少量的设备上,保证正常的浏览显示没有问题 缩放方案:接入难度非常小 效果中上
GitHub - Alfred-Skyblue/v-scale-screen: Vue large screen adaptive component vue大屏自适应组件
安装组件
bash
npm i v-scale-screen使用组件并制定宽高
注:以 1920 * 1080 为标准尺寸比
src\views\BigScreenView.vue
js
import VScaleScreen from 'v-scale-screen'vue
<v-scale-screen width="1920" height="1080">
   <div class="all-charts">
   </div>

   <!-- 3d模型渲染节点 -->
    <div class="model-container">
      <!-- 进度条 -->
      <LoadingComponent :loading="showLoading" />
      <!-- 准备3D渲染节点 -->
      <canvas class="canvas-3d" ref="ref3d" />
    </div>
</v-scale-screen>